Key points#
- The first question about any finding is not whether it is exciting but what kind of study produced it. Study design sets the ceiling on what a paper can honestly claim.
- Relative numbers sound dramatic, while the absolute change tells you what a result means for a real person. Reading both, and asking for the absolute numbers when only the relative figure is given, is the single highest-yield habit.
- A p-value and a confidence interval describe how compatible the data are with various effects, not the probability that a claim is true or false. Plain-language translations help you avoid the most common misreadings.
- Observational findings are clues, not verdicts. Because groups differ in many ways at once, confounding can create or erase an apparent association, so these studies generate hypotheses rather than prove cause and effect.
- Good reading is about the evidence, never the people. A study can be observational or small or short without anyone having done anything wrong, and limitations are features of the design.
- A short, repeatable checklist (design, outcome, absolute effect, precision, confounding, applicability) lets a patient or trainee appraise a paper without any advanced statistics.
How to read a medical study: the short answer#
To read a medical study without a statistics degree, work through the same six questions in the same order every time: what kind of study is it, what was measured, what is the absolute (not just relative) effect, how precise is it, could confounding or chance explain it, and do the people studied resemble you. You do not need to recompute anything. You need a method that tells you whether a result is solid and whether it matters to a real person. The rest of this post walks through that checklist in plain language.
A new finding usually reaches us already compressed. A news segment, a social post, or even a journal abstract has squeezed months of work into one striking number, and the number is almost always the version that sounds biggest. "Cuts the risk by half" travels. The quieter sentence next to it, the one that says what half actually amounts to, rarely makes the headline.
The fix is not more statistics. It is a method. If you read every paper in the same order, asking the same handful of questions, you do not need to recompute anything to know whether a result is solid and whether it matters to a real person. This post lays out that method as a calm, repeatable checklist any patient or trainee can use.
One principle runs through the whole thing, and it is worth stating up front: comment on the evidence, never the people. A finding can be preliminary, small, or limited without anyone having done anything wrong. An observational study is observational by design, not by mistake. When this series describes a limitation, it describes a feature of the method, not a fault of the researchers.
Reading the literature carefully is part of ordinary generalist primary care. A primary care clinician can field a question about a blood pressure target, a cancer screening interval, and a brand-new drug in a single afternoon. The same plain reading habits serve all three.
First question: what kind of study is it?#
Before the result, find the design. It is usually stated in the title and spelled out in the methods section, and it tells you the most important thing about a paper: what it is allowed to claim.
A few designs cover most of what you will read:
- Case reports and case series describe what happened in one or a few patients. They are valuable signals, the first hint that something is worth a closer look, but a handful of observations cannot tell you how often something happens or whether a treatment caused it.
- Cross-sectional surveys take a snapshot of a population at one moment. They are good for describing how common something is right now, less good for telling you what leads to what.
- Case-control and cohort studies are observational. Researchers watch what happens to people who differ in some factor, without assigning anyone to a treatment. A cohort follows groups forward in time; a case-control study starts from an outcome and looks backward. Both can reveal strong associations, and neither, on its own, can prove cause.
- Randomized controlled trials assign treatment by chance. That single design choice, randomization, is what lets a trial speak to cause and effect, because on average the groups start out alike in everything except the treatment.
- Systematic reviews and meta-analyses pool many studies under an explicit, reproducible method. A meta-analysis combines their numbers; a systematic review gathers and appraises the whole body of evidence on a question.
This ordering is the idea behind a levels-of-evidence hierarchy, such as the Oxford CEBM levels and the framework in the JAMA Users' Guides. Systematic reviews of trials and well-conducted trials sit near the top; case reports and expert opinion sit lower. Useful as that is, treat it as a starting point rather than an automatic ranking. A carefully done observational study can be more trustworthy than a poorly done trial. The design tells you what a paper can claim; the conduct tells you how much to trust it.
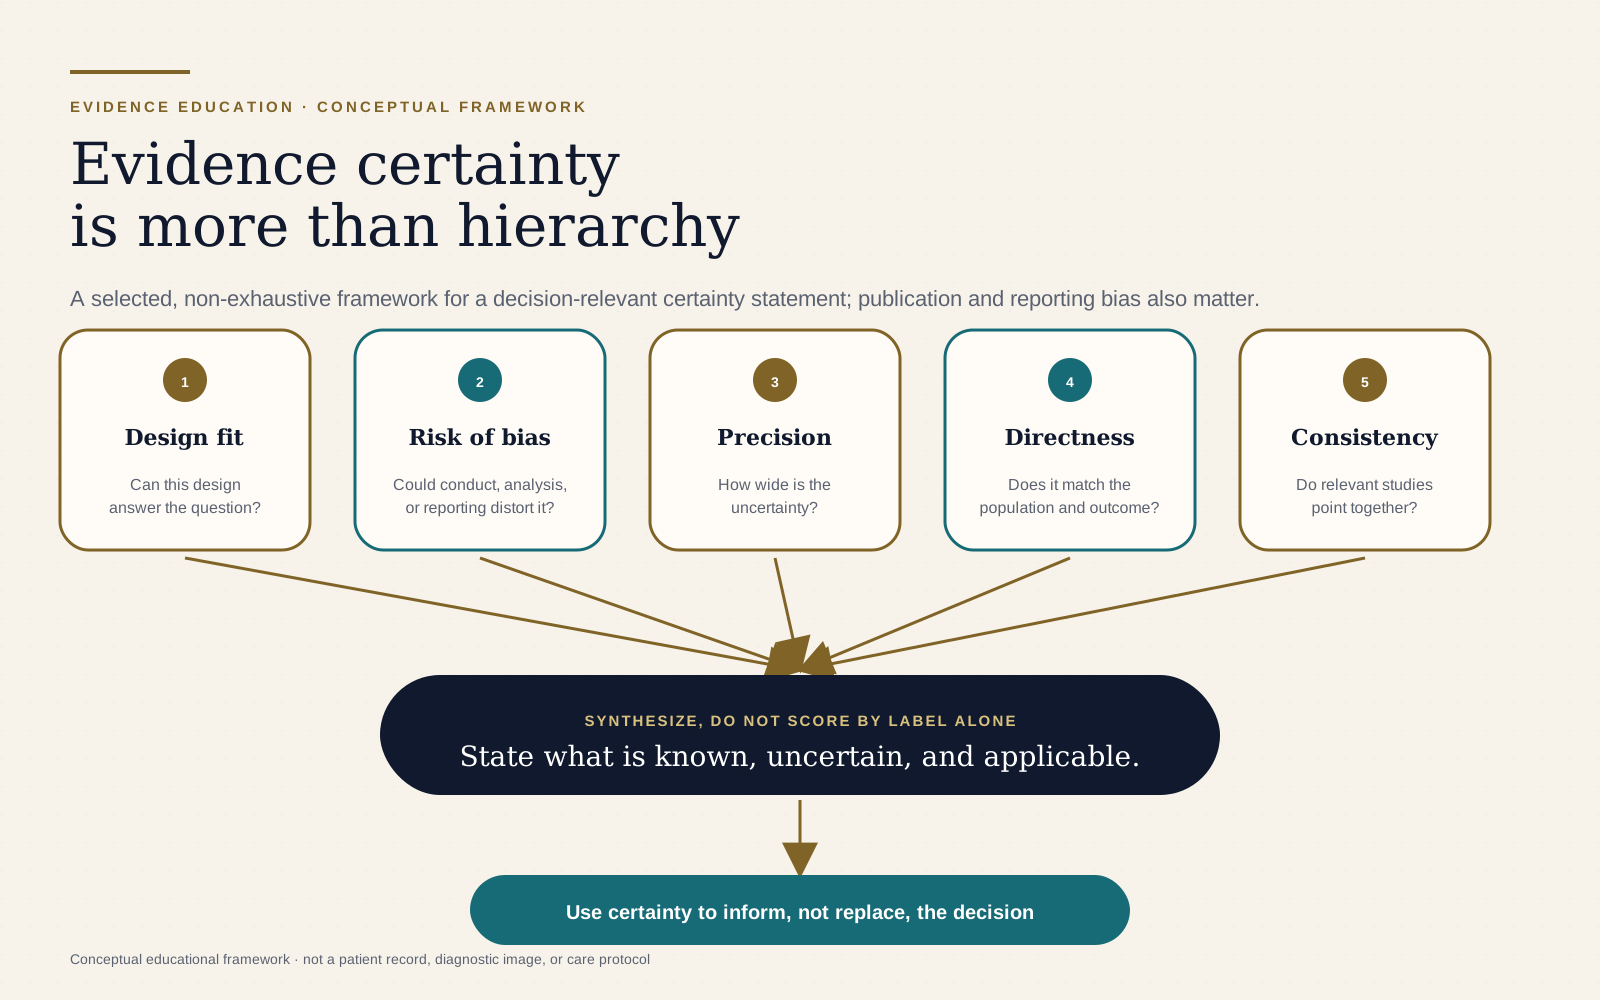
Scroll horizontally to inspect the full figure. A complete text version follows.
Read the figure in text
Five selected inputs feed the synthesis: whether the design fits the question, risk of bias including selective analysis or reporting, precision, directness to the target population and outcome, and consistency across relevant studies. Publication bias and other domain-specific concerns can also change certainty. The synthesis states what is known, uncertain, and applicable before informing a decision.
Next: what was actually measured?#
Find the primary outcome and ask one question: does it matter to patients?
There is a real difference between patient-important outcomes and surrogate outcomes. Patient-important outcomes are the things people actually feel or care about: living longer, having fewer symptoms, staying out of the hospital, better quality of life. Surrogate outcomes are stand-ins, usually a lab value or an imaging finding that is easier and faster to measure. A drug that lowers a blood marker has changed the surrogate. Whether that translates into a person feeling better or living longer is a separate question, and not always a yes.
Watch for composite outcomes, where several events are bundled into one count, say heart attack, stroke, and hospitalization combined. A composite can make a study more efficient, but it can also let a change in the least serious component carry the headline. When you see one, look at the individual pieces and ask which part is actually moving.
Two more habits help. Check the follow-up time, because a benefit that shows up at six weeks may look different at two years. And check how each outcome was defined and counted, because a generous or vague definition can inflate an effect. None of this requires math. It requires reading the methods as carefully as the conclusion.
Absolute vs relative risk (the most useful habit)#
This is the one to keep if you keep nothing else.
Imagine a treatment that lowers an event rate from 2 in 100 to 1 in 100. Three numbers describe that same result, and they feel completely different:
- The relative risk reduction is 50 percent. The event rate fell from 2 to 1, which is a halving. This is the number that sounds large.
- The absolute risk reduction is 1 percentage point. Out of 100 people, one fewer had the event. This is what changed in the real world.
- The number needed to treat is about 100. Roughly 100 people would take the treatment for one of them to avoid the event.
Every one of those is correct, and they describe the identical finding. The relative figure is not wrong, it is just incomplete, and on its own it can make a small benefit feel like a revolution. So the rule is simple: when a study, a press release, or an abstract gives you only a relative number, go find the absolute numbers in the results text or the tables. If they are hard to find, stay cautious, and ask why the plain count is not on display.
One more piece makes this sharper. Baseline risk matters. The same 50 percent relative reduction does very different things depending on where you start. For someone whose risk is 20 in 100, halving it removes 10 events. For someone whose risk is 2 in 100, halving it removes 1. A relative reduction helps a high-risk person far more than a low-risk one, which is why the same drug can be worth taking for one patient and barely worth it for another. The standard definitions here are laid out in general appraisal sources such as the CEBM tools and the JAMA Users' Guides.
Confidence intervals and p-values in plain terms#
These two are misread more than any other part of a paper, so it is worth slowing down. The clearest plain-language guide to the common errors is Greenland and colleagues, and the descriptions below follow it.
A confidence interval is a range of effect sizes that are reasonably compatible with the data. If a study reports a relative risk of 0.80 with a 95 percent interval from 0.65 to 0.98, read it as: the data are most consistent with about a 20 percent reduction, and they are compatible with anything from a fairly large benefit to a very small one. A wide interval means more uncertainty, which often just means the study was small. A narrow interval means a more precise estimate. And here is the practical test: if the interval for a difference includes the point of no effect, a relative risk of 1, or a difference of 0, then the result is statistically inconclusive at that level.
A p-value measures how compatible the observed data are with a specific scenario, usually the scenario of no real effect. A small p-value tells you the data would be surprising if there were truly no effect. It does not give the probability that the claim is true, and a large p-value does not prove there is no effect; it may just mean the study was too small to detect one.
Two practical points carry most of the weight here. First, statistical significance is not the same as clinical importance. A result can clear the significance bar and still be too small to change anything a patient would notice. Second, a single result is rarely the final word. Findings get firmer as they are replicated. When you are deciding whether an effect is both real and large enough to matter, the confidence interval usually tells you more than a lone p-value, because it shows you the size of the effect and the uncertainty around it at the same time.
Confounding, and why observational findings are clues not verdicts#
Here is the heart of why observational studies cannot, by themselves, prove cause.
In an observational study, nobody assigns the treatment or behavior being studied. People sort themselves. So the groups being compared usually differ in many ways at once: age, overall health, habits, income, access to care. When you then find that a factor lines up with an outcome, you genuinely cannot tell whether the factor caused the outcome or whether some other difference between the groups did. That problem is called confounding.
The structure of it is easy to picture in the abstract. Suppose people who do X also tend to do Y, and Y is the real driver of the outcome. A study that looks only at X will see X and the outcome travel together and may conclude that X is responsible, when the credit, or the blame, belongs to Y. The association is real. The causal story attached to it is not.
Researchers have tools to push back on this. They can adjust for known differences in the analysis, match people with similar characteristics, or restrict the study to one type of person so the groups are more alike. These help, sometimes a great deal. But they can only handle the factors that were measured. Unmeasured confounding can always remain, and you can never fully rule out a difference nobody recorded.
This is the thesis of the whole series. Observational studies are very good at generating hypotheses and spotting signals, and they are sometimes the only ethical or practical way to study a question. What they cannot do alone is establish causation. So a careful reader treats their findings as clues to be tested, most definitively in randomized trials. And to say it plainly one more time: being observational is a neutral feature of a study's design. It is not a flaw, and it reflects nothing about the people who did the work.
A one-page checklist you can reuse#
Here is the whole post compressed into something you can keep beside any paper.
- Design. What kind of study is it, and what can that design legitimately claim? A well-designed, well-conducted randomized trial can support causal inference; an observational study mostly speaks to association.
- Outcome. What is the primary outcome, and does it matter to patients? Watch for surrogates and composites, and check the follow-up time.
- Absolute effect. What is the absolute risk reduction and the number needed to treat, not just the relative figure? If only the relative number is given, go find the absolute one.
- Precision. How wide is the confidence interval, and is the effect clinically meaningful, not just statistically significant?
- Confounding and chance. Could confounding or chance explain the result? Was the study observational, and if so, what did the authors adjust for?
- Applicability. Do the people in the study resemble me or my patient? Check the inclusion and exclusion criteria, the ages, the other conditions, and the setting.
That is the ethic of this whole series in six lines. Appraise the evidence generously and precisely. Keep the focus on methods and numbers rather than on people. Treat any single study as one data point inside a larger body of work, which is exactly how bodies like the U.S. Preventive Services Task Force weigh evidence before making a recommendation. To go deeper on any one step, the appraisal resources linked throughout, from CEBM and the JAMA Users' Guides to the CONSORT reporting standard for trials, are written for exactly this purpose.
Putting the method to work#
You do not need to calculate anything to read a study well. You need to ask the questions in the right order and refuse to let a single relative number stand in for the whole picture. Find the design, find the real outcome, convert the relative figure into an absolute one, read the interval rather than chase the p-value, and ask whether confounding or chance could be doing the work. Then ask the last question, the one that decides whether any of it applies: are these people like me, or like the patient in front of me?
Do that consistently and most headlines lose their grip, not because you have become cynical, but because you have a method. The number that traveled was real. Now you can see what it is worth.
Sources and further reading
- Greenland S et al. Statistical tests, P values, confidence intervals, and power, Eur J Epidemiol 2016
- Oxford Centre for Evidence-Based Medicine (CEBM) Levels of Evidence
- Cochrane, about systematic reviews
- JAMA Users' Guides to the Medical Literature (JAMAevidence)
- EQUATOR Network and the CONSORT statement
- U.S. Preventive Services Task Force, methods and processes
Questions and answers
What is the difference between absolute risk and relative risk?
Relative risk compares two groups as a ratio or percentage change, for example a risk cut in half, while absolute risk is the actual change in events, for example from 2 in 100 down to 1 in 100. The relative figure can sound dramatic even when the absolute change, and the related number needed to treat, is modest. Reading both, and looking for the absolute numbers whenever only the relative figure is reported, is the most useful single habit when reading a study.
Does a small p-value mean a result is true or important?
No. A p-value describes how compatible the data are with a scenario of no real effect. It is not the probability that the claim is true, and it says nothing on its own about whether an effect is large enough to matter to patients. A result can be statistically significant yet clinically trivial, and a non-significant result does not prove there is no effect. This is one of the most common misreadings, summarized clearly in a widely cited guide by Greenland and colleagues.
How do I read a confidence interval without a statistics background?
Think of a confidence interval as the range of effect sizes that are reasonably compatible with the data. A narrow range suggests a more precise estimate, often from a larger study, while a wide range signals more uncertainty. If the interval for a difference includes the point of no effect, such as a relative risk of 1, the result is inconclusive at that level. Many readers find the interval more informative than a single p-value, because it shows both the likely size of an effect and how uncertain it is.
Why can't an observational study prove that something causes a disease?
In observational studies, researchers watch what happens rather than assigning treatment by chance, so the groups being compared usually differ in many ways at once. This is called confounding: an apparent link between a factor and an outcome may actually be driven by something else, such as age, overall health, or access to care. Researchers can adjust for known differences, but unmeasured ones can remain. That is why observational findings are best treated as clues that generate hypotheses, which randomized trials are better positioned to test.
Which study designs are considered stronger evidence?
Frameworks such as the Oxford CEBM levels and the JAMA Users' Guides concept generally place systematic reviews of randomized trials and well-conducted randomized controlled trials above observational studies, with case reports and expert opinion lower down. The hierarchy is a useful starting point, not an automatic ranking: a carefully done study of a lower tier can be more trustworthy than a flawed study of a higher tier, so the design tells you what a paper can claim, while the conduct tells you how much to trust it.
How can I tell if a study's findings apply to me or my patient?
Check who was actually studied. Look at the inclusion and exclusion criteria, the age range, the other conditions present, and the setting, then ask whether those people resemble you or your patient. A treatment effect measured in one population may be larger, smaller, or simply untested in another. Applicability is the final checklist item for a reason: even a well-conducted study only helps a specific decision if the people in it are similar enough to the person in front of you.